
Microsoft Fabric: Empowering a New Era of Connectivity and Collaboration
In today’s interconnected world, the need for seamless connectivity and collaboration has become paramount. Businesses are grappling with a massive influx of data and diverse technologies, making it challenging to streamline operations and extract valuable insights. Recognizing these hurdles, Microsoft has developed a groundbreaking solution: Microsoft Fabric. With its innovative features and unified approach, Fabric is set to revolutionize the way organizations connect, collaborate, and harness the power of data and AI technologies.
This tutorial guides you step-by-step through a complete process, starting from getting the data to using it. It helps you learn the basics of Fabric, including its different features and how they work together. It also covers the experiences of both professional developers and non-technical users, giving you a well-rounded understanding of this platform.
Before going further, You should know that Microsoft Fabric is in Preview mode (Pre-release online service) and Microsoft can make some changes before its releases to a larger audience.
What is Microsoft Fabric?
Microsoft Fabric is a complete analytics solution that helps businesses with their data needs. It includes everything from moving and organizing data to analyzing it in real-time and gaining insights. It offers a range of services like data storage, data processing, and data integration, all in a single platform.
Why is it created?
Microsoft Fabric is a solution created to tackle the difficulties of working with a highly fragmented market of data and AI technologies. In this market, there are many different companies offering different services and this can be challenging for customers, as they often have to work together with different services from different vendors/companies, which can be complicated and costly.
Fabric simplifies this process by providing a single product that brings all the necessary capabilities together. It offers a unified experience and architecture, making it easier for developers to extract insights from data and present them to the business user. Instead of dealing with multiple disconnected services, Fabric brings everything under one roof.
If you are using Microsoft Fabric then you don’t have to struggle with different tools from different companies. Instead, you get a seamless and user-friendly solution that covers all your analytics requirements in one place, making it easier for you to manage and analyze your data.
Advantages of Microsoft Fabric
Microsoft Fabric with SaaS integration provides several advantages, that includes:
- A wide variety of integrated analytics for various industries.
- Familiar and easy-to-learn experiences that are shared across different tools.
- Convenient access and reuse of assets for developers.
- A unified data lake that allows you to keep your data in one place while using preferred analytics tools.
- Centralized administration and governance across all experiences for better management.
Microsoft Fabric Terminology
Microsoft Fabric is based on Software as a Service (SaaS) which makes it incredibly simple and integrated for users. This brings together new and existing components from Power BI, Azure Synapse, and Azure Data Explorer into a single integrated environment.

1. Data Factory in Microsoft Fabric
In Microsoft Fabric, Data Factory is the data integration component that combines the capabilities of Azure Data Factory and Power Query Dataflows into one place. It allows you to ingest, prepare and transform data from rich data sources such as databases, data warehouses, lakehouses, real-time analytics, and more.
There are two primary high-level features Data Factory implements:
- Dataflows: It is an easy-to-use interface to import data from numerous sources and apply over 300 data transformations. Once transformed, the data can be loaded into various destinations, including Azure SQL databases and others. Dataflows can be executed manually or scheduled for regular updates, making them suitable for data pipeline orchestration.
- Pipelines: Data pipelines are cloud-scale workflow capabilities, empowering you to create intricate workflows. With data pipelines, you can automate dataflow updates, efficiently handle large datasets, and define advanced control flow pipelines. Data pipelines incorporate control flow capabilities, enabling you to design workflow logic with features like loops and conditionals.
Here we have a few more features that enable you to perform data integration tasks:
- Connectors: It allows you to connect to different types of data stores and access data from various sources. You need connectors to ingest, transform, and load data in dataflows or data pipelines.
- Data pipeline: It allows you to build complex workflows that can refresh your data flow, move Petabyte size data, and define sophisticated control flow pipelines. You need data pipelines to orchestrate and automate your data integration activities and tasks.
- Data Lake Storage Gen2: In Fabric, Dataflows (known as Dataflow Gen2) is a user-friendly, low-code approach to import data from multiple sources and perform data transformations. Dataflow Gen2 provides additional features beyond Dataflows in Power BI or Azure Data Factory. Note: there is no direct upgrade path from Dataflow Gen1 to Gen2.
2. Data Engineering in Microsoft Fabric
Data Engineering is the process of designing, building, and maintaining infrastructures and systems that enable organizations to collect, store, process, and analyze large volumes of data. It provides capabilities to ensure that your data is easily accessible, well-organized, and high-quality. Below are some of the capabilities which Data Engineering provides in Microsoft Fabric, that is:
- Lakehouse: A lakehouse is a database-like structure stored in a data lake, used by Apache Spark and SQL engines for processing big data. It offers advanced features like ACID transactions with Delta tables. In Microsoft OneLake, the lakehouse resides within a dedicated workspace folder, containing files of different formats organized in folders and subfolders.
- Apache Spark job definition: An Apache Spark Job Definition enables you to submit batch or streaming jobs to a Spark cluster. By uploading compiled binary files (e.g., .jar from Java), you can apply various data transformation operations to the data stored in the lakehouse. Additionally, you can customize the job’s behavior by uploading extra libraries and command line arguments.
- Notebook: A notebook is a versatile interactive programming tool that allows users to write code and markdown, execute and monitor Spark jobs, view and visualize results, and collaborate with teammates. It is particularly useful for data engineers and data scientists to explore and process data, as well as build machine learning experiments using both code and a user-friendly interface. Moreover, it can be seamlessly transformed into a pipeline activity for efficient orchestration. You can use notebooks in various programming languages, such as Python, R, Scala, etc.
- V-order: Fabric utilizes a write optimization technique for the parquet file format, ensuring speedy reads, cost efficiency, and improved performance. By default, all Fabric engines write parquet files in a v-ordered manner.
3. Data Science in Microsoft Fabric
Microsoft Fabric allows users to go through the entire process of data science, starting from exploring and cleaning the data to creating models and getting useful insights for business. With Microsoft Fabric, you can do many tasks like data exploration, preparation and cleansing experimentation, modeling, model scoring and serving of predictive insights to Power BI reports.
Below we have the capabilities which are offered by the Data Science in Microsoft Fabric:
- Data Wrangler: A Data Wrangler is a tool, based on notebooks, designed to assist in data analysis tasks. It provides a grid-like interface to visualize and explore your data and dynamic summary statistics. One of its notable features is that each operation you perform generates reusable code that can be saved within your notebook for future use.
- Machine Learning Experiment: A machine learning experiment is a valuable tool for data scientists to document essential information while running their machine learning code effectively. It allows them to log crucial details such as parameters, code versions, metrics, and output files. Furthermore, the experiment enables downloading run files and metadata, facilitating further analysis in external tools.
- Machine Learning Model: A machine learning model is a file that has the capability to identify particular patterns. By utilizing a dataset and an algorithm, you can train the model, enabling it to learn from the provided data. Once the training process is complete, the model gains the ability to examine unfamiliar data and generate predictions based on the patterns it has learned.
4. Data Warehouse in Microsoft Fabric
The Warehouse in Microsoft Fabric leverages the capabilities of the SQL engine and an open data format. This combination allows you to focus on data preparation, analysis, and reporting without worrying about multiple copies of data. Everything is stored in a single place, Microsoft OneLake, making it easier to manage and work with your data efficiently.
Below are two types of warehouses available in Microsoft Fabric:
- SQL Endpoint of the Lakehouse
- Synapse Data Warehouse

SQL Endpoint of the Lakehouse:
A SQL Endpoint is automatically generated from a Lakehouse. With the SQL Endpoint, customers can use SQL queries to view the data from the warehouse.
SQL Endpoint is read-only, which means you can’t make changes to the data directly through it. Instead, any modifications to the data need to be done using the Lakehouse’s “Lake” view with Spark.
Through the SQL Endpoint, you have access to a limited set of SQL commands. These commands allow you to define and query data objects, but you can’t manipulate the data itself. Some of the things you can do in the SQL Endpoint include:
- Query tables that reference data in your Delta Lake folders within the lake.
- Create views, inline TVFs (Table-Valued Functions), and procedures to encapsulate your specific logic and rules using T-SQL.
- Manage permissions on the objects, controlling who can access and interact with them.
Synapse Data Warehouse:
In contrast to a SQL Endpoint, which only allows you to perform read-only queries and create views and TVFs (Table-Valued Functions), a Warehouse provides full support for both transactional data definition language (DDL) and data manipulation language (DML) operations. A customer can create a Warehouse according to their specific needs.
In Warehouse, you can use various data ingestion methods supported by Microsoft Fabric. These methods include options like COPY INTO, Pipelines, Dataflows, or cross-database ingestion options such as CREATE TABLE AS SELECT (CTAS), INSERT, SELECT, or SELECT INTO. These methods allow you to bring data into the Warehouse from different sources and perform actions like copying, transforming, and merging data based on your requirements.
5. Real-Time Analytics in Microsoft Fabric
Real-Time Analytics is seamlessly integrated with the entire suite of Microsoft Fabric products. This integration allows you to effortlessly load and transform data from various sources into the platform. It also provides advanced visualization capabilities, enabling you to create meaningful and insightful visual representations of your data.
Here we have unique features of Real-Time Analytics:
- It is easy to capture, transform and route real-time events to different destinations such as custom applications.
- You can easily load your data from any source or format.
- You can directly run analytical queries on warehouse data without creating any data models or scripts to transform the data.
- It integrates with other experiences and items in Microsoft Fabric.
- It helps you to scale up to an unlimited amount of data from gigabytes to petabytes.
Basically, there are three capabilities that are offered by Real-time Analytics in Microsoft Fabric:
- KQL Database: The KQL database is a database designed to store data in a format that allows for executing KQL queries on it.
- KQL Queryset: The KQL Queryset is a tool for running queries, examining results, and manipulating query outputs from your Data Explorer database. It consists of databases, tables, queries, and results. With the KQL Queryset, you can save queries for later use, as well as export and share them with others.
- Event Stream: It offers a convenient way to capture, transform, and route real-time events within the Fabric platform. With a user-friendly interface requiring no coding, event streams combine streaming data sources, ingestion destinations, and event processors for seamless data transformation when necessary.
OneLake and Lakehouse
In Microsoft Fabric, Lakehouse is a Data architecture platform that is used to store, manage and analyze both structured and unstructured data in a single location.
OneLake is built with a combination of Microsoft Fabric services and provides a unified location to store all the data in one place. It works similarly to how OneDrive works for personal files. OneLake is designed to be the central location for all your analytics data. It offers two main benefits:
- One DataLake for the whole organization: Instead of having separate data storage spaces, OneLake provides a single, unified data lake that can be accessed by everyone in your organization.
- One copy of data for multiple analytical engines: With OneLake, you only need to store one copy of your data, even if you’re using multiple analytical engines.
In Microsoft Fabric, the concept of a tenant is an important feature. It provides a unique benefit by giving each customer’s organization its own distinct boundary and control, managed by a tenant admin. This boundary helps with governance and compliance, ensuring data is protected and managed appropriately.

When data is stored in OneLake, it is automatically governed according to the default rules set by the tenant admin. However, it’s essential to avoid the tenant admin becoming a central gatekeeper that restricts other parts of the organization from contributing to OneLake. The goal is to strike a balance between control and collaboration.
Within a tenant, you have the flexibility to create multiple workspaces. Workspaces allow different parts of the organization to have ownership and manage access policies for their specific data. Each workspace is associated with a particular region and has its own separate billing.
Databricks also has a similar concept to Lakehouse. If you want to know about it, click: What is Databricks Lakehouse?
Lakehouse Advantage
Earlier, organizations were using separate systems for transactional and structured Data Analytics (Data Warehouse) and Big Data Analytics (Data Lakehouses) which resulted in duplicate data. This has led to cost increases. With the introduction of Microsoft Fabric, all these systems are combined together into one system using the Delta Lake format which eliminated the cost and reduces the duplication of data.
With Microsoft Fabric, you can implement a Data Warehouse, Data Lakehouse, and also a combination of both.
Lakehouse Demo Scenario
In this scenario, we will create a lakehouse and ingest data from an existing Excel file which will create a table and then we will test the ingested data by running the query. Finally, we will create a Power BI report from this table.
Steps to Build a Lakehouse
You should have Power BI Pro or a premium account. If you do not have it you can try the trial subscription
1. Create Workspace: Sign into a Power BI account and create Workspace. Follow the instructions provided in the screenshots.

Provide the name of the workspace.


2. Create a Lakehouse and name it Demo Lakehouse.
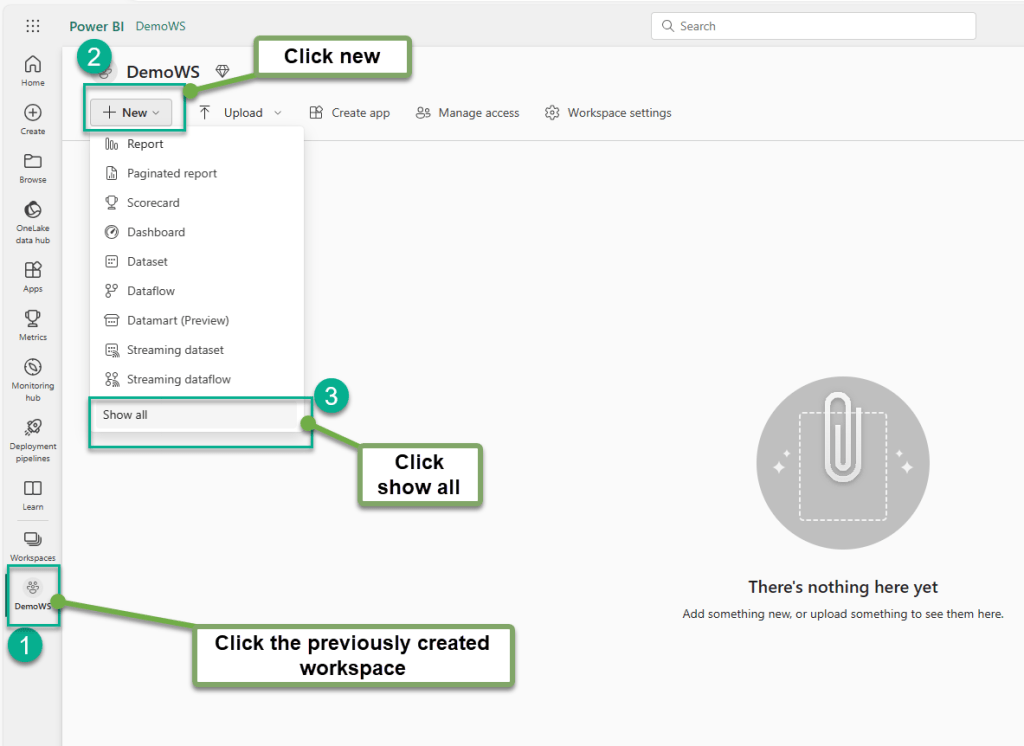

3. Ingest Data into Lakehouse: Once the Lakehouse is created it will show you Lakehouse view like this. Now let’s create a dataflow to ingest the data into Lakehouse.

We will use an Excel file to import the data.

We will upload the Excel file into Lakehouse.

Now download the Sample file from dimension_customer.csv and convert it into an Excel file. We will upload the Excel file into Lakehouse.

Now it shows you the table name here so you will create the table with the name of the Excel file. The table name is Dimension_customer.

If you want you can change the Table name in the properties section. Now push this data to the Lakehouse by Add data destination option. We will choose the Lakehouse name from existing Lakehouse names. In the list, there could be multiple warehouses. To choose the warehouse you have to click the + button and it will open the dialog box where you can select the warehouse.

Select the Lakehouse name where you want to push the data into and proceed further to publish step.

Select the update method. We will use Replace method to create a brand-new table.

Now you are on the publishing screen where you can see that it shows an existing lakehouse.

This means it is ready to publish to the selected Lakehouse. So press Publish button.

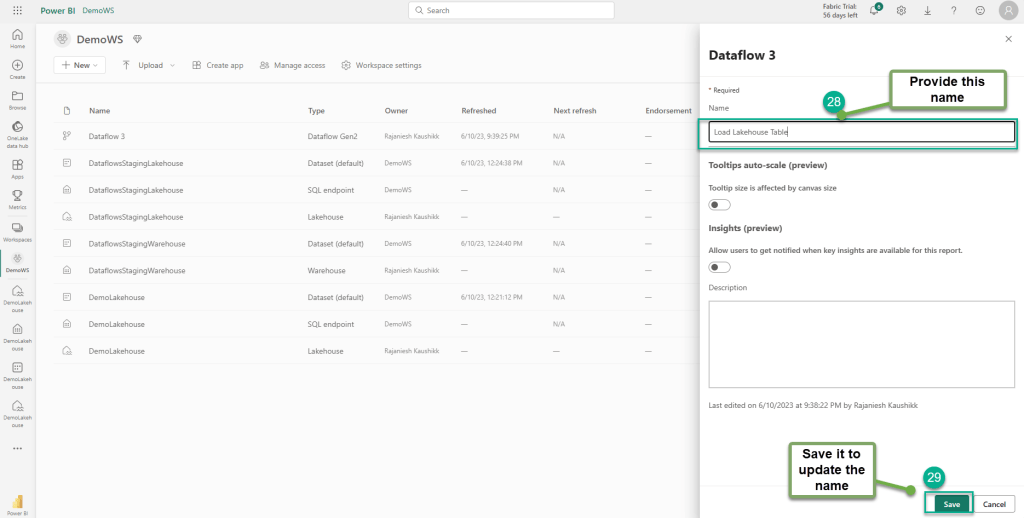
This process created a dataflow that published the data. We will rename the Dataflow name.

We will rename it to Load Lakehouse Table.
Now we will refresh the data. After refreshing the data, we will create a query to view the data.Now we will go back to the lakehouse view to view the table.

We will create a query to view the data from Lakehouse. For this, we will create a new query and select the SQL Endpoint to connect to the Lakehouse.

We will paste this query.
SELECT BuyingGroup, Count(*) AS Total
FROM dimension_customer
GROUP BY BuyingGroup
4. Build a report: We will build a Power BI report from the default data set.

The automatic report is created with one click as depicted below.

Microsoft Fabric will create an instant report from the dataset and this is how it will look like.

Now you can save the report name

Conclusion
Microsoft Fabric is a game-changing analytics platform that simplifies and integrates data and AI services for enterprises. It enables users to leverage the power of generative AI and language models, such as Azure OpenAI Service, to create and use everyday AI experiences. In this article, we have discussed how Microsoft Fabric provides a unified and easy-to-use experience for different roles and tasks, such as Data Engineering, Data Warehousing, Data Science, Data Factory, Real-time analysis, and Power BI. With Fabric, organizations can unlock the potential of their data and lay the foundation for the era of AI.
[…] If you want to learn more about Microsoft Fabric please refer to my Fabric blog here. […]